You’ve probably heard this quote before: ” If you can’t measure it, you can’t improve it”.
It is said to have been said by Lord William Thomson Kelvin in the19th century… 19th.
To give you an idea, we are currently in the21st century (2022). This means that ” experts ” have been thinking about continuous improvement and measuring their performance for more than 200 years.

However, when it comes to HR analytics, this discipline is barely coming to our Quebec SMEs. Some are well advanced on the subject, while others are struggling to establish the foundations that allow them to analyze their performance, but especially the HR trend in their company.
If you’ve ever thought about starting in HR measurement, but don’t really know where to start, know that there are a few sources of French-speaking inspiration on the market, including the very relevant Andrée Laforge and her blog : Measuring Human Capital.
For my part, it has had a great influence on my practice in this area.
While waiting for the creation of your first HR dashboard, I offer you 12 HR STATISTICS TO KNOW IN 2022 to feed your thoughts.

More than 53% of employees would be open to changing employers in the next 12 months. It is well known that labour shortages are a global phenomenon and affect most SMEs and large companies. Spring
The job market is changing completely. Values and expectations of employees have evolved. To avoid too big a wave of departures, I recommend that you ask yourself the question : what do my employees really want today? The answer is often simpler than you think.
On the other hand, 69% of employees are more likely to stay more than 3 years in the same company when they have a great experience during onboarding (Clickboarding)

21% is the average turnover rate in Canada (imercer). According to various studies, just over 27% of workers leave their jobs voluntarily?

No wonder more than 70% of executives make retention their #1 goal this year.

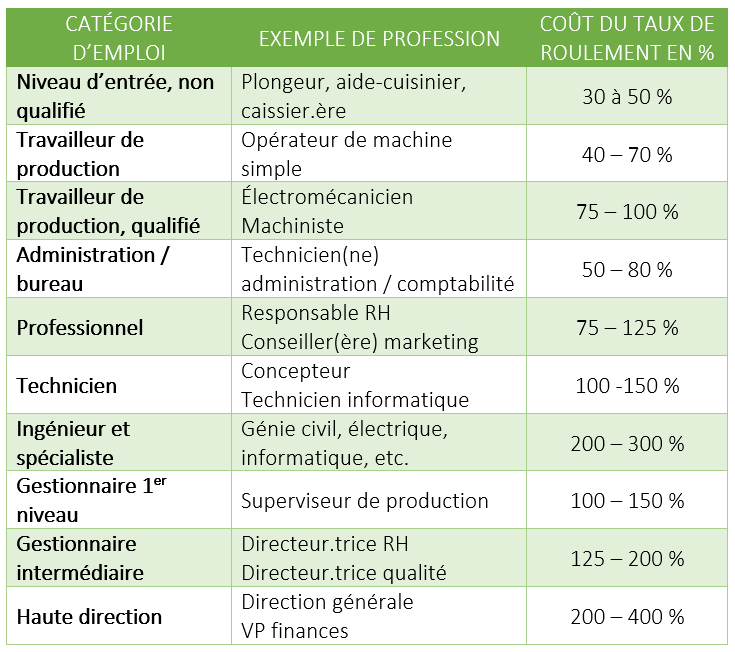
The cost of the turnover rate varies between 30% and 400% of the employee’s annual salary. The cost depends on the level of knowledge and experience required for the position. Obviously, we are talking about an employee who is in full possession of his or her means and therefore competent for the position occupied.
There are 2 known ways to calculate the cost of the turnover rate in the company. The CHRP Order published a detailed fact sheet a few years ago, which will allow you to have the precise details.
On the other hand, if you’re more like me, you can get an equivalent result using the quick method proposed by The Jack Phillips Center for Research:


On average, in Quebec, replacing an employee will cost $23,970. This calculation takes into account the average salary in 2021 ($28.81), for a non-skilled worker. Calculation : (28.81 x 2080) x 40% = $23,970 This amount includes all associated costs, direct and indirect costs to the replacement.

Up to 20% of departures occur within the first 45 days. This is very interesting data. It shows that when this happens, it is (strong?) possible that the onboarding process is not optimal to ensure the success of your new employee. Recruitment (and training) is expensive on several levels. It is important to ensure that investments are profitable.
Which brings me to the next statistic.

$4,129 is the average cost per hire. According to the Society for Human Resource Management (SHRM), the average cost per hire is $4,129 for all positions. In our community, this figure has been circulating for some time. Although my research has yielded nothing concrete on the subject, let’s bet that the cost is much higher today following the pandemic.

21% more profitable! Overall, this is what companies with a high level of employee engagement can expect: to be 21% more profitable than companies with a low engagement rate.
Who says measuring employee satisfaction (or engagement) is a good investment ?

The lack of recognition and commitment pushes 44% of employees to change jobs. The most recent surveys in this area show a lack of recognition on the part of our organizations. Our employees, currently, are looking for meaning and recognition. They will not hesitate to leave an organization that takes them for granted, regardless of the terms and conditions of employment.
I can hear you say to me: ” Yes, but Mathieu, I can’t spend my day congratulating everyone for everything and nothing. I have a job to do and so do they.”
I understand your point, and to that I answer that recognition is a perception and it can be transmitted at different levels and at various times in your company.
Recent studies have shown that after receiving ONLY ONE form of recognition in the last month, 62% of employees surveyed said they were HIGHLY RECOGNIZED
1 time a month!
I don’t know about you, but I fell off my chair when I saw this.
By the way, if you need inspiration on the subject, we have created a training course to help as many leaders as possible build a strong culture of recognition in their company.


42 days is the average time to recruit in Canada
Just like other statistics, this is an average for all types of positions. However, we are not far from the reality.
Today, in all transparency, my batting average is slightly below 30 days. Obviously, I have 1 or 2 home runs, but also 1 or 2 foul balls (no strikeouts though. Knock on wood). That’s why we talk about average.
For several years, I have been telling my clients and colleagues that recruiting a good profile takes an average of 1 month. Note that the trend has been upward in recent months.
This must be taken into account in our annual hiring and mobility plan. This also means that when an employee gives 2 weeks’ notice, there is a good chance that the position will remain vacant for at least 2 weeks…
When I was HR Director in a company, we set ourselves the goal of being under the average of 25 days. Something we had managed to do, in the sector with the most shortage in Quebec (before the pandemic).
It was really a strategic axis and we devoted a lot of time and energy to it. We had to put in place a process and tools to help us be more effective and efficient while promoting the experience of the candidates we were interacting with within 24/48 hours.
Imagine the financial impact of reducing a vacancy by a single day (multiplied by the number of positions being recruited). Depending on the case, this could result in a reduction in overtime, a reduction in the risk of accidents, an increase in productivity, etc.
As with any business function, it’s important to have a strategy, processes AND tools that will help improve performance.

Salary (67%) and benefits (63%) are the 2 most important pieces of information for job seekers (Glassdoor)
I know we often mention that salary is not everything. However, job seekers today are not dumb and are aware of the current demand in the market.
In a recent discussion with a group of college graduates, several confirmed to me that they completely ignore job offers when the salary is not posted.
Several other studies show that the number of applications received is higher when the salary is posted.
In fact, pay transparency is gaining momentum south of the border. A growing trend across North America.
Bonus ?

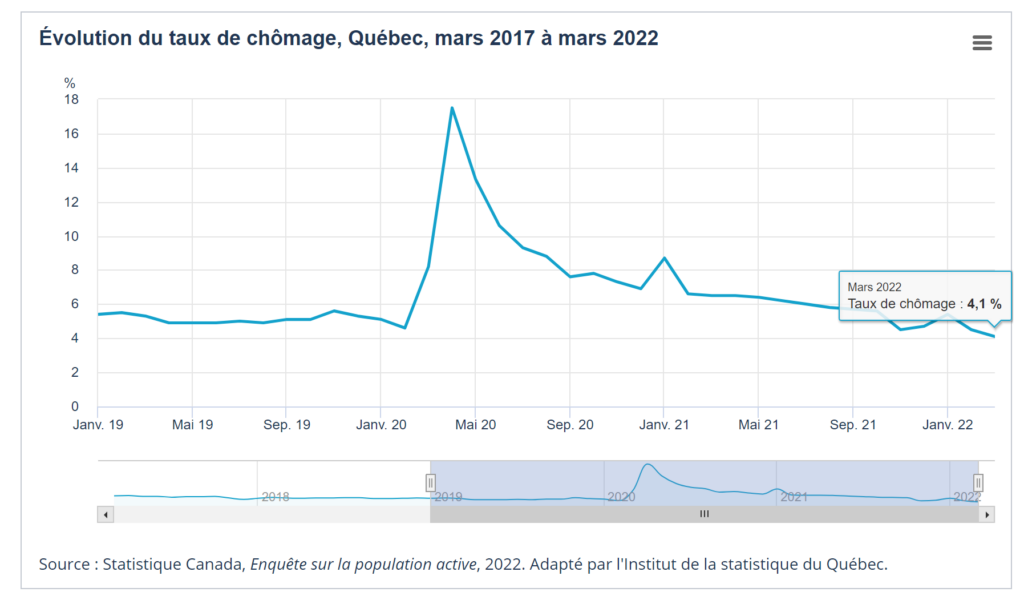
1% is the unemployment rate in March 2021. According to Statistics Canada, this would be the lowest percentage ever recorded!

I am curious, what statistic(s) or HR performance indicator(s) do you follow in your company?
Have any statistics surprised you?
Thank you for taking the time to read this blog and if you ever want to discuss it, I invite you to come and join me on LinkedIn.
Article written by Mathieu St-Amant.


